Introduction
Once you have deployed your machine learning model to production it rapidly becomes apparent that the work is not over.
In many ways the journey is just beginning. How do you know if your models are behaving as you expect them to? What about next week/month/year when the customer (or fraudster) behavior changes and your training data is stale? These are complex challenges, compounded by the fact that machine learning monitoring is a rapidly evolving field in terms of both tooling and techniques. As if that wasn’t enough, monitoring is a truly cross-disciplinary endeavor, yet the term “monitoring” can mean different things across data science, engineering, DevOps and the business. Given this tough combination of complexity and ambiguity, it is no surprise that many data scientists and ML engineers feel unsure about monitoring.
This comprehensive guide aims to at the very least make you aware of where the complexity in monitoring machine learning models in production comes from, why it matters, and furthermore will provide a practical starting point for implementing your own ML monitoring solutions. If it’s sample code, step-by-step tutorials and example projects you are looking for, you might be interested in our online course dedicated to the topic: Testing & Monitoring Machine Learning Model Deployments. This post is not aimed at beginners, but don’t worry. You should be able to follow along if you are prepared to follow the various links. Let’s dive in…
Contents
1. The ML System Lifecycle
2. What makes ML System Monitoring Hard
3. Why You Need Monitoring
4. Key Principles For Monitoring Your ML System
5. Understanding the Spectrum of ML Risk Management
6. Data Science Monitoring Concerns [Start here for practical advice]
7. Operations Monitoring Concerns
8. Bringing Ops & DS Together - Metrics with Prometheus & Grafana
9. Bringing Ops & DS Together - Logs
10. The Changing Landscape
1. The ML System Lifecycle
The monitoring of machine learning models refers to the ways we track and understand our model performance in production from both a data science and operational perspective. Inadequate monitoring can lead to incorrect models left unchecked in production, stale models that stop adding business value, or subtle bugs in models that appear over time and never get caught. When ML is at the core of your business, a failure to catch these sorts of bugs can be a bankruptcy-inducing event - particularly if your company operates in a regulated environment.
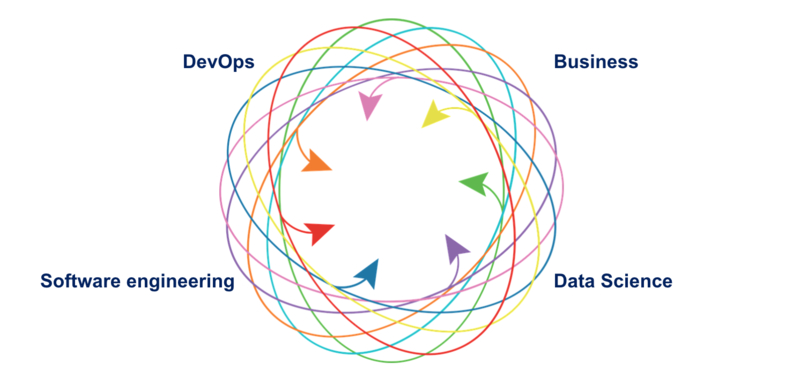
Martin Fowler has popularized the concept of Continuous Delivery for Machine Learning (CD4ML), and the diagram for this concept offers a useful visual guide to the ML lifecycle and where monitoring comes into play:
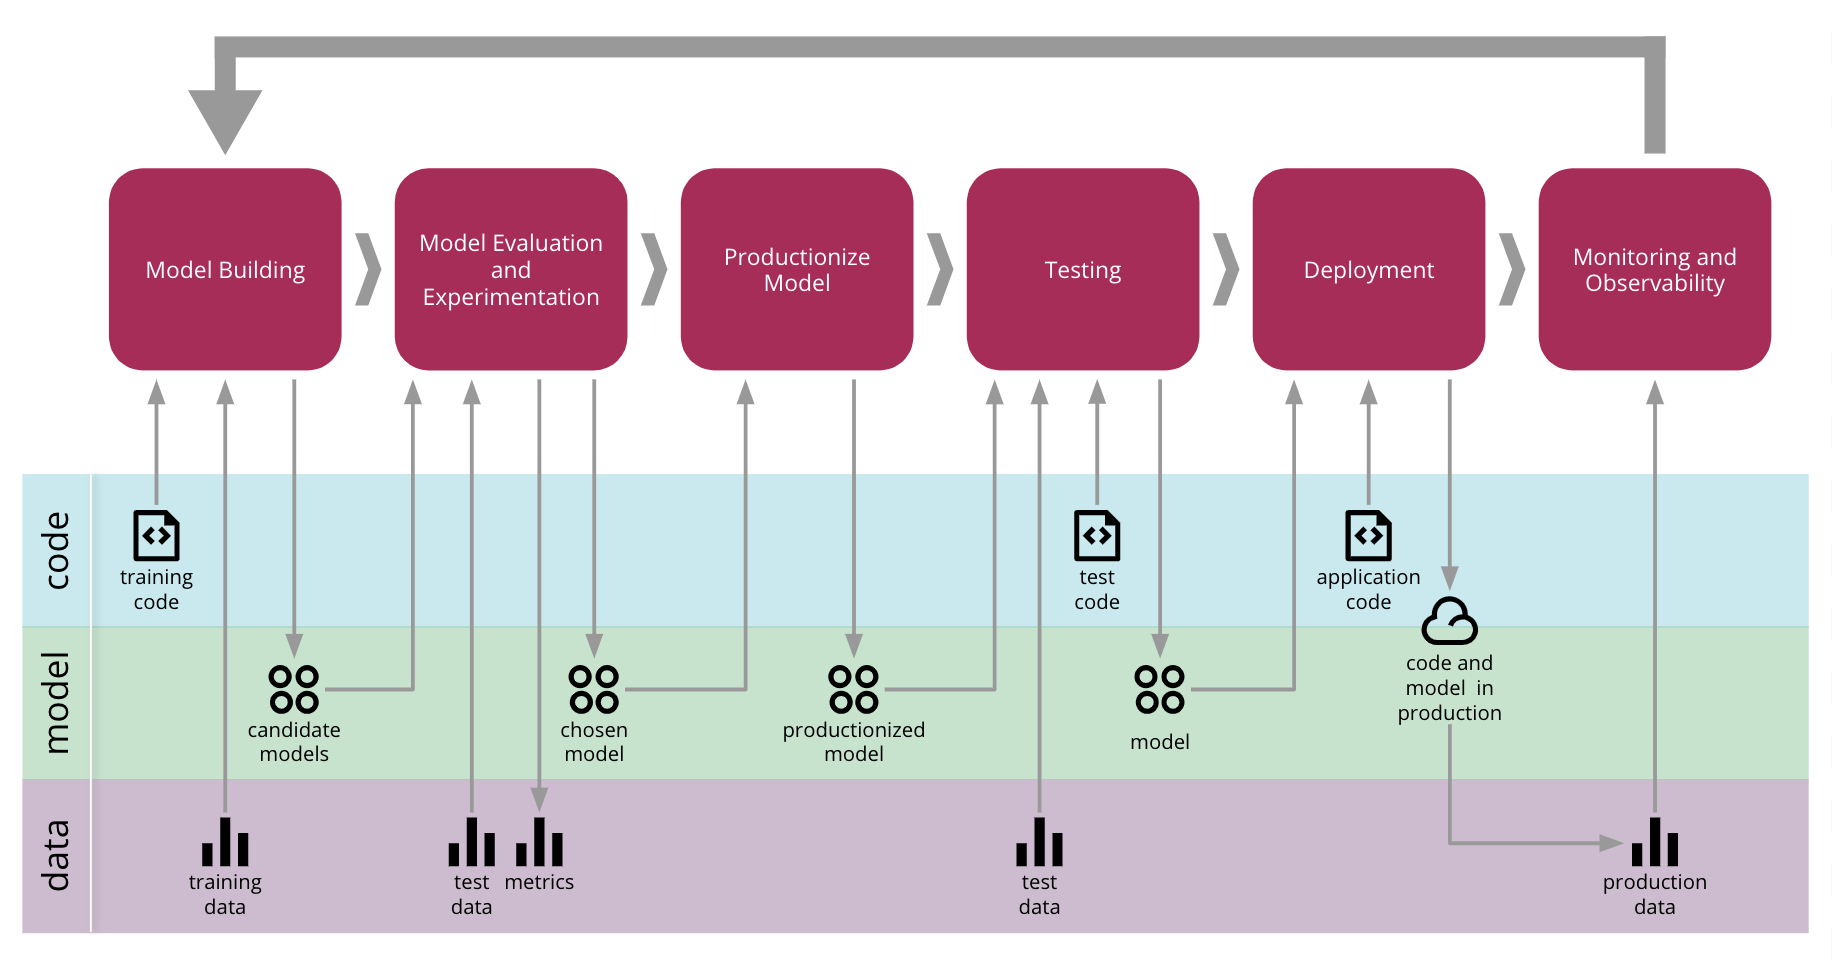
Notice the cyclical aspect, where information collected in the final “Monitoring & Observability” (more on observability soon) phase feeds back to the “Model Building”. For most companies, this is a non-automated process of evaluating the impact of a model from a business perspective and then considering whether the existing model needs updating, abandoning or might benefit from a complementary model. In more advanced companies, it could mean the data collected during the monitoring phase directly feeding into training data for model updates in an automated fashion (which carries with it plenty of additional challenges which we will discuss soon). You could consider the first two phases of the diagram (“model building” and “model evaluation”) as the research environment typically the domain of data scientists, and the latter four phases as more the realm of engineering and DevOps, though these distinctions vary from one company to another. If you’re not sure about what the deployment phase entails, I’ve written a post on that topic.
Monitoring Scenarios
As with most things in software, it is maintainability where the real challenges lie. Deploying and serving an ML model in Flask is not overly challenging. Where things get complex is doing this in a reproducible way, particularly amid frequent updates to a model. Our typical update scenarios look like this:
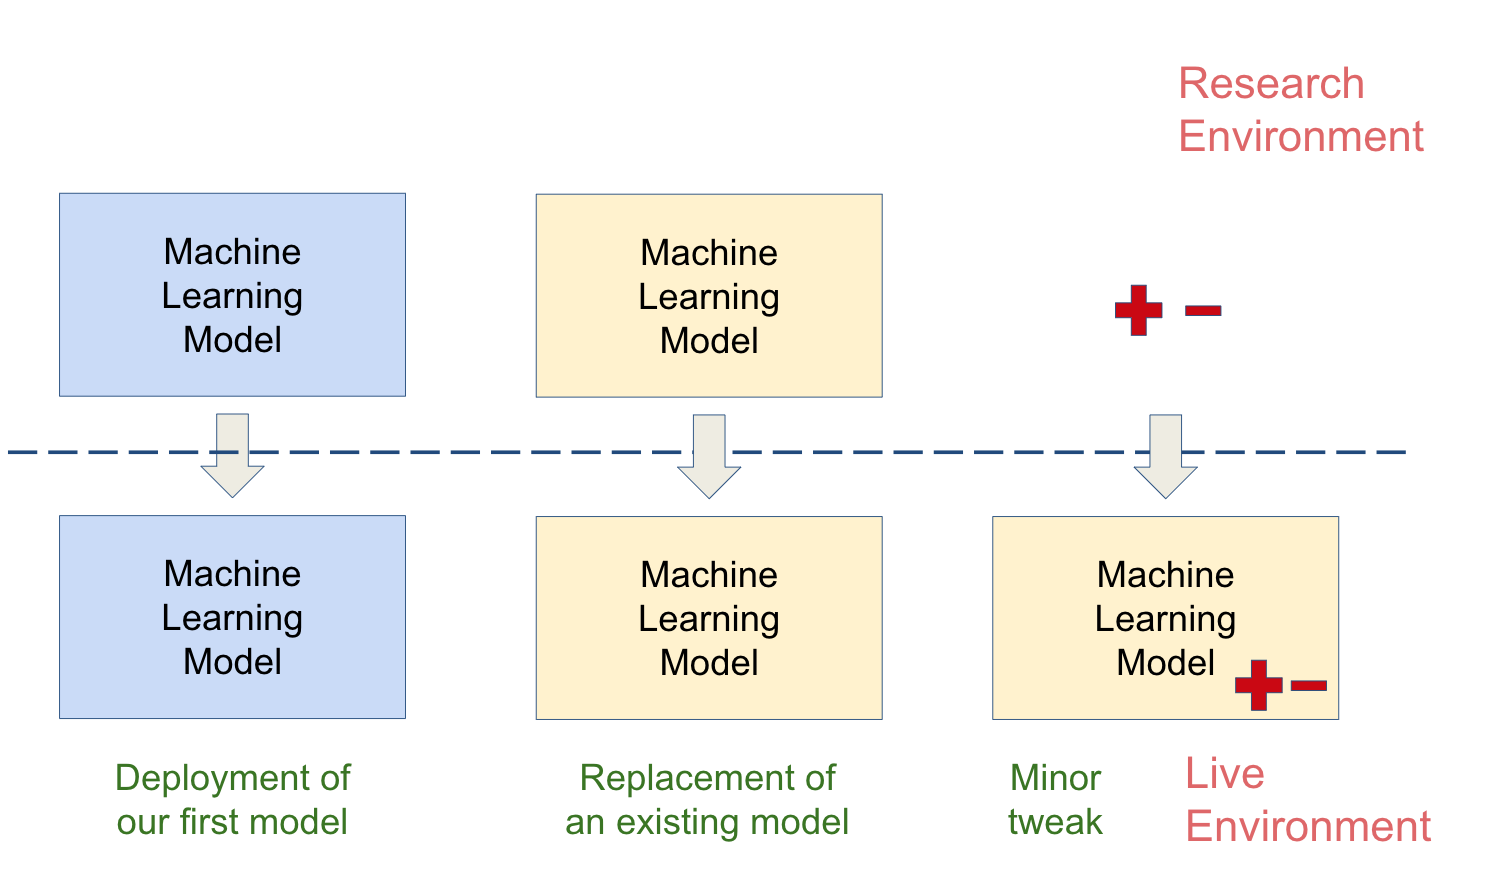
The first two scenarios are pretty self-explanatory. The third scenario (on the right) is very common and implies making small tweaks to our current live model. Say we have a model in production, and one variable becomes unavailable, so we need to re-deploy that model without that feature. Or alternatively we develop a super feature that we think is going to be awesomely predictive, and we want to re-deploy our model, but now taking that new feature as an additional input.
Regardless of the situation, monitoring is how we determine whether our model changes are having the desired effect, which is what we ultimately care about. The only exception to this rule is shadow deployments, which I explain in this post. But before we delve into the specifics of monitoring, it’s worth discussing some of the challenges inherent in ML systems to build context.
2. What makes ML System Monitoring Hard
Machine learning systems have all the challenges of traditional code, and then an additional array of machine learning-specific considerations. This is well documented in the paper from Google “Hidden Technical Debt in Machine Learning Systems”
A key point to take away from the paper mentioned above is that as soon as we talk about machine learning models in production, we are talking about ML systems.
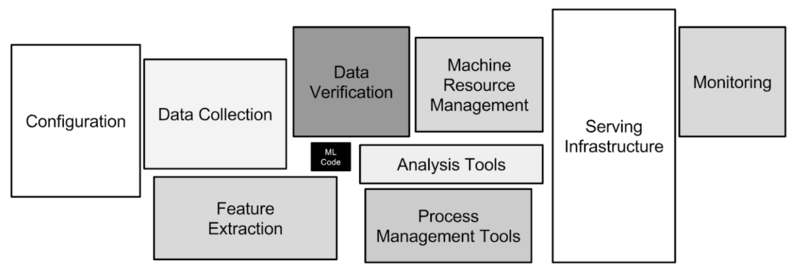
The model is a tiny fraction of an overall ML system (image taken from Sculley et al. 2015):
When it comes to an ML system, we are fundamentally invested in tracking the system’s behavior. This comes down to three components:
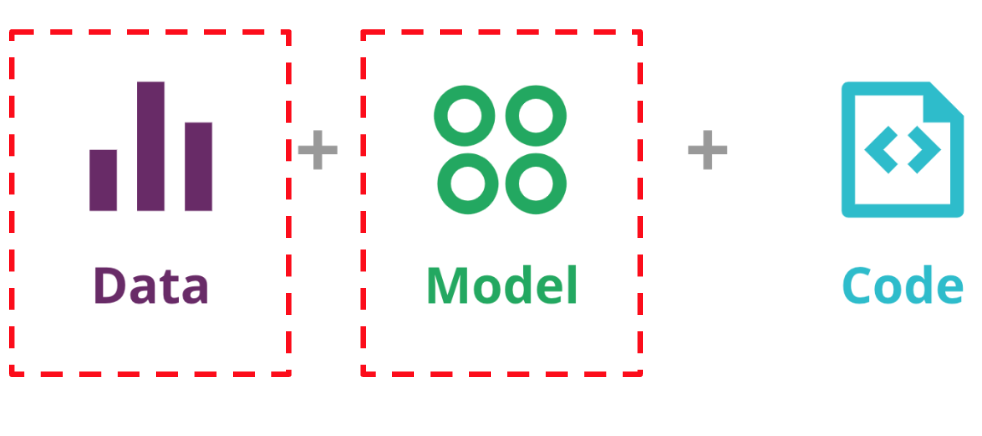
- Code (and Config)
- Model (ML System specific requirement)
- Data (ML System specific requirement)
We have two additional components to consider in an ML system in the form of data dependencies and the model. Unlike in traditional software systems, an ML system’s behavior is governed not just by rules specified in the code, but also by model behavior learned from data. To make matters more complex, data inputs are unstable, perhaps changing over time.
Without a way to understand and track these data (and hence model) changes you cannot understand your system.
But it doesn’t end there. This is not as simple as “OK, we have two additional dimensions to consider” (which is challenging enough). Code & config also take on additional complexity and sensitivity in an ML system due to:
-
Entanglement: When an input feature is changed, then the importance, weights or use of the remaining features may all shift as well. This is also known as the “changing anything changes everything” issue. ML system feature engineering and selection code need to be very carefully tested.
-
Configuration: Because model hyperparameters, versions and features are often controlled in the system config, the slightest error here can cause radically different system behavior that won’t be picked up with traditional software tests. This is especially true in systems where models are constantly iterated on and subtly changed.
Hopefully it’s starting to become clear that ML Systems are hard. Another challenge to consider is the sheer number of teams involved in the system.
The Responsibility Challenge
ML Systems Span Many Teams (could also include data engineers, DBAs, analysts, etc.):
Before we continue breaking down monitoring, it’s worth mentioning that the word has different connotations in different parts of a business.
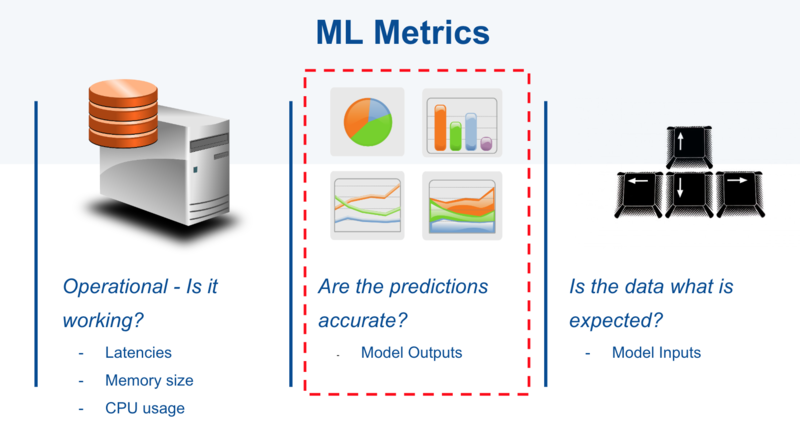
Data scientists: Once we have explained that we’re talking about post-production monitoring and not pre-deployment evaluation (which is where we look at ROC curves and the like in the research environment), the focus here is on statistical tests on model inputs and outputs (more on the specifics of these in section 6).
Engineers & DevOps: When you say “monitoring” think about system health, latency, memory/CPU/disk utilization (more on the specifics in section 7)
For ML systems you need both of these perspectives. Whereas in traditional software practice monitoring and observability tend to fall onto DevOps, in an ML system it is unlikely that your DevOps team will have the necessary expertise to correctly monitor ML models (unless you have a unicorn DevOps engineer & Data Scientist in one person, who you should cling on to and give a raise). This means that:
- The whole team needs to work together on monitoring and speak each other’s language in order for the system to be effective
- That it’s important to define our terms to avoid confusion.
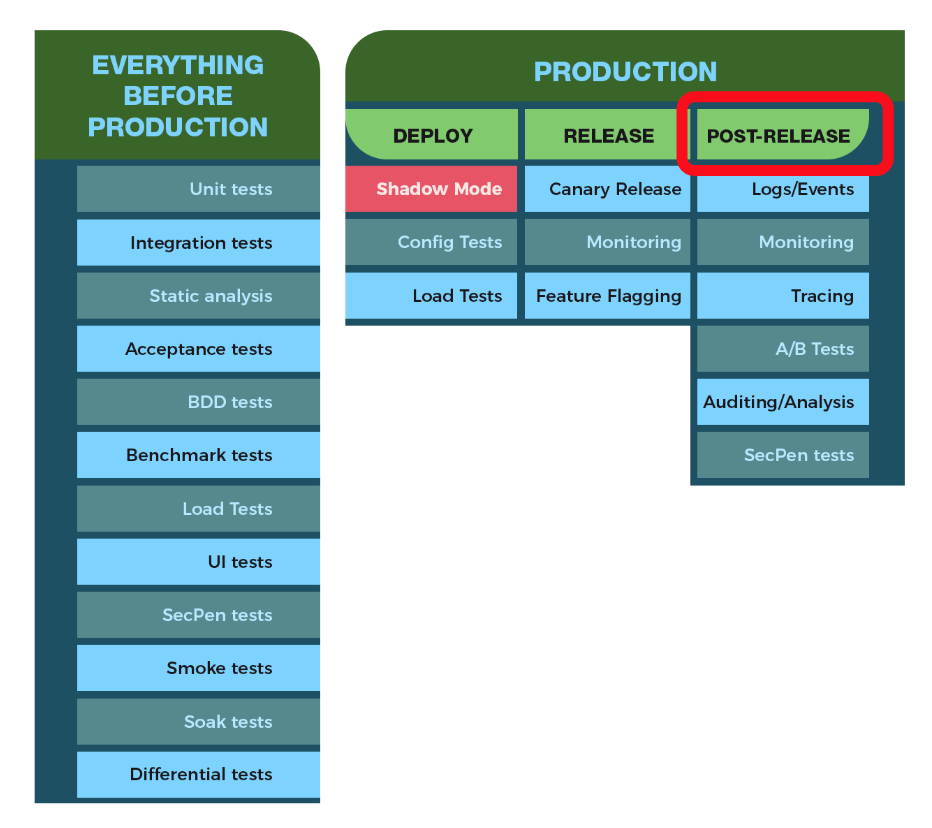
What all this complexity means is that you will be highly ineffective if you only think about model monitoring in isolation, after the deployment. Monitoring should be planned at a system level during the productionization step of our ML Lifecycle (alongside testing). It’s the ongoing system maintenance, the updates and experiments, auditing and subtle config changes that will cause technical debt and errors to accumulate. Before we proceed further, it’s worth considering the potential implications of failing to monitor.
3. Why You Need Monitoring
“By failing to prepare, you are preparing to fail”
Benjamin Franklin
Monitoring should be designed to provide early warnings to the myriad of things that can go wrong with a production ML model, which include the following:
Data Skews
Data skews occurs when our model training data is not representative of the live data. That is to say, the data that we used to train the model in the research or production environment does not represent the data that we actually get in our live system.
There are multiple reasons why this can happen:
-
We designed the training data incorrectly: Distributions of the variables in our training data do not match the distribution of the variables in the live data.
-
A feature is not available in production: This often means that we need to either remove the feature, change it for an alternative similar variable that exists in production, or re-create that feature by combining other features that exist in production.
-
Research/Live Data mismatch: Data we used to train our models in the research environment comes from one source and the live data comes from a different source. This can mean that the variables may not be fabricated identically, so even though the pipeline returns the same prediction for the same input data (which will mean our differential tests pass), different data sources may lead to inherent different values in the same features, which will result in different predictions.
-
Data Dependencies: Our models may ingest variables that are created or stored by other systems (internal or external). These systems may change the way they produce the data, and sadly it’s common that this is not communicated clearly. The knock-on effect is that the variables that are produced today are not equivalent to those that were produced a few years ago. Either the code implementation of a feature changes, producing slightly different results, or the definition of a feature may change. For example, an external system may adjust the voting age from 18 to 16. If voting age is a significant feature in the model, this will change its predictions.
Model Staleness
-
Shifts in the environment: If we use historic data to train the models, we need to anticipate that the population and its behavior may not be the same in current times. For example, if we train our financial models using data from the time of the recession, it may not be effective for predicting default in times when the economy is healthy.
-
Changes in consumer behavior: Customer preferences change with trends in fashion, politics, ethics, etc. Particularly in recommender ML systems this is a risk that has to be constantly monitored.
-
Adversarial scenarios: Bad actors (fraudsters, criminals, foreign governments) may actively seek out weaknesses in your model and adjust their attacks accordingly. This is often an ongoing “arms race”.
Negative Feedback Loops
A more complex issue arises when models are automatically trained on data collected in production. If this data is swayed/corrupted in any way, then the subsequent models trained on that data will perform poorly. Here at minute 37:00 you can here Dan Shiebler for Twitter’s Cortex AI team describe this challenge:
“We need to be very careful how the models we deploy affect data we’re training on […] a model that’s already trying to show users content that it thinks they will like is corrupting the quality of the training data that feeds back into the model in that the distribution is shifting.”
4. Key Principles For Monitoring Your ML System
Whilst academic machine learning has its roots in research from the 1980s, the practical implementation of machine learning systems in production is still relatively new. With a few pioneering exceptions, most tech companies have only been doing ML/AI at scale for a few years, and many are only just beginning the long journey. This means that:
- The challenges are often misunderstood or completely overlooked
- The frameworks and tooling are rapidly changing (both for data science and MLOps)
- The best practices are often grey
- The regulatory requirements are changing all the time (think GDPR)
Nowhere is this more true than monitoring, which perhaps explains why it is so often neglected.
Research papers detailing best practices around system design, processes, testing and monitoring written by companies with experience in large-scale ML deployments are extremely valuable. Drawing out common themes and issues can save you and your company huge amounts of blood, sweat and tears. Two of the most experienced companies in the ML space, Google and Microsoft, have published papers in this area with a view to helping others facing similar challenges. The two papers are:
- The ML Test Score: A Rubric for ML Production Readiness and Technical Debt Reduction (2017) Breck et al. (Google)
- Software Engineering for Machine Learning: A Case Study (2019) Amershi et al. (Microsoft)
The Google paper focuses more on ML system testing and monitoring strategies that can be employed to improve such systems in terms of reliability, reducing technical debt and lowering the burden of long-term maintenance. The Google paper is structured around 28 tests, a rubric for gauging how ready a given machine learning system is for production. These tests are “drawn from experience with a wide range of production ML systems”.
The Microsoft paper takes a broader view, looking at best practices around integrating AI capabilities into software. The paper presents the results from surveying some 500 engineers, data scientists and researchers at Microsoft who are involved in creating and deploying ML systems, and providing insights on the challenges identified.
Both papers highlight that processes and standards for applying traditional software development techniques, such as testing, and generally operationalizing the stages of an ML system are not yet well-established.
Key Monitoring-Related Principles from the Papers
From Breck et al., 2017:
- Monitor 1: Dependency changes result in [a] notification
- Monitor 2: Data invariants hold in training and serving inputs, i.e. monitor Training/Serving Skew
“It can be difficult to effectively monitor the internal behavior of a learned model for correctness, but the input data should be more transparent. Consequently, analyzing and comparing data sets is the first line of defense for detecting problems where the world is changing in ways that can confuse an ML system.”
- Monitor 3: Training and serving features compute the same values
- Monitor 4: Models are not too stale
- Monitor 5: The model is numerically stable
- Monitor 6: The model has not experienced dramatic or slow-leak regressions in training speed, serving latency, throughput, or RAM usage
- Monitor 7: The model has not experienced a regression in prediction quality on served data
Perhaps the most important and least implemented test is the one for training/serving skew (Monitor 3). This sort of error is responsible for production issues across a wide swath of teams, and yet it is one of the least frequently implemented tests. In part this is because it is difficult […].
Despite its lack of prioritization, to its credit the Google paper has a clear call to action, specifically applying its tests as a checklist. This is something I heartily agree with, as will anyone who is familiar with Atul Gawande’s The Checklist Manifesto.
It’s important to note that many of these best practices depend on reproducibility, which Sole Galli & I discuss in this talk
5. Understanding the Spectrum of ML Risk Management
What all testing & monitoring ultimately boils down to is risk management. They are both techniques we use to increase our confidence that the system functionality is what we expect it to be, even as we make changes to the system. There is a spectrum of risk management. At one end of the spectrum we have the system with no testing & no monitoring. This is a system with grim future prospects (which is unlikely to even start-up in production), but also a system that making adjustments to is very easy indeed. At the other end we have the most heavily tested system with every imaginable monitoring available setup. This is a system where we have a very high level of confidence in its behavior, but where making changes to the system is extremely painful and time-consuming. In this way testing & monitoring are like battle armor. Too little and you are vulnerable. Too much, and you can barely move.
Notice as well that the value of testing and monitoring is most apparent with change. Most ML Systems change all the time - businesses grow, customer preferences shift and new laws are enacted.
When we talk about monitoring, we’re focused on the array of post-production tools we have available to us to minimize our risk. Our goal is to identify shifts in our ML system behavior that conflict with our expectations.
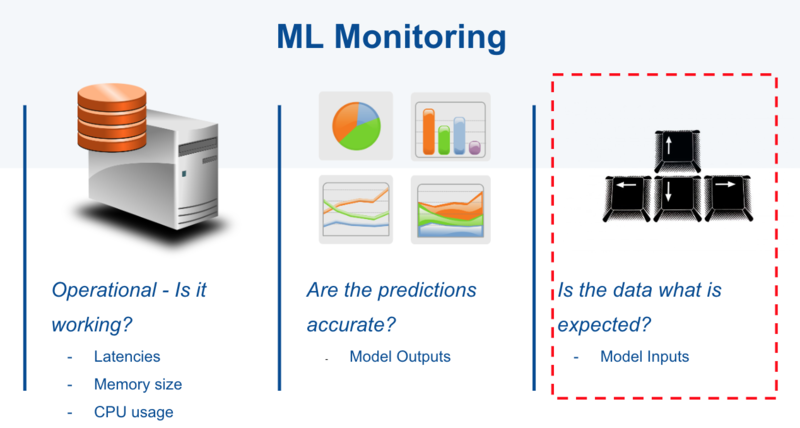
Broadly speaking, we can categorize the ways our ML system can go wrong into two buckets:
- Data Science issues (data monitoring, prediction monitoring)
- Operations issues (system monitoring)
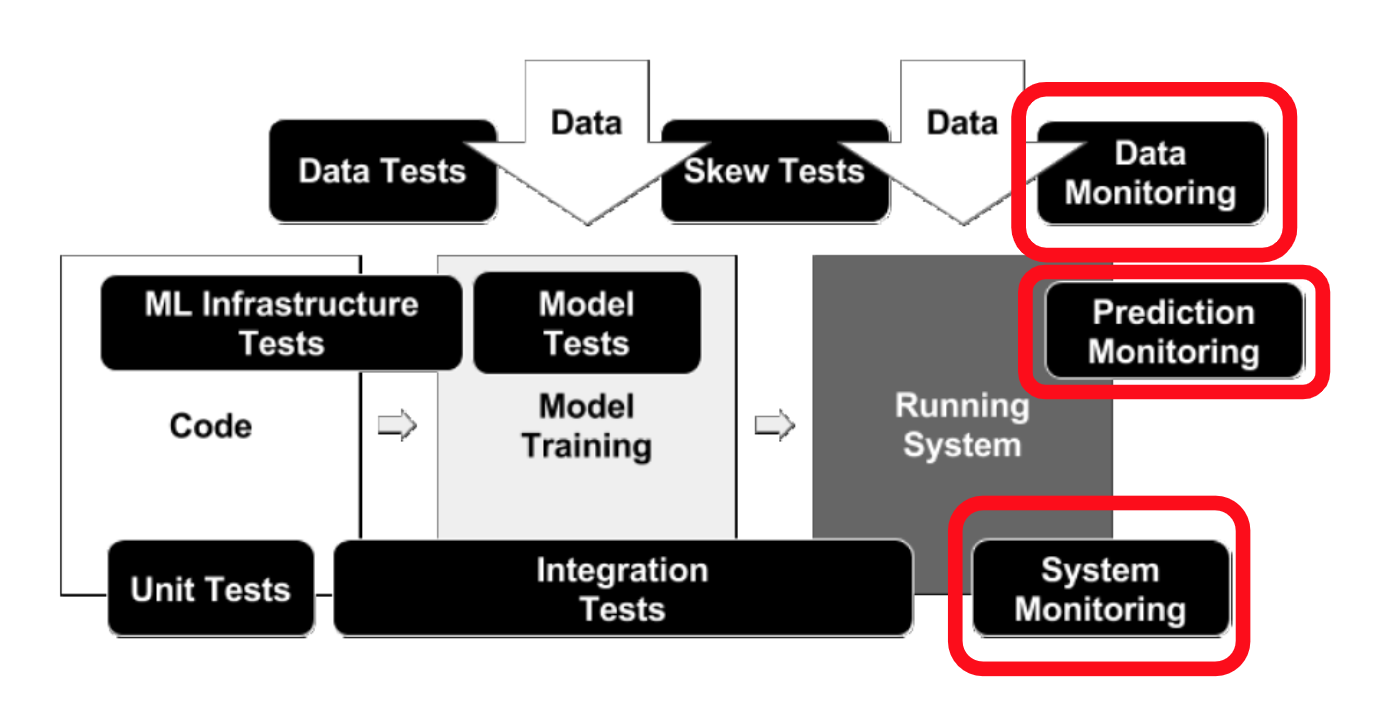
source: Breck et al. (2017)
As we will see in the upcoming sections, for effective solutions these two areas need to come together, but as we are gaining familiarity it is useful to first consider them individually.
6. Data Science Monitoring
Naturally, we are interested in the accuracy of our model(s) running in production. Yet in many cases it is not possible to know the accuracy of a model immediately. Take the case of a fraud detection model: Its prediction accuracy can only be confirmed on new live cases if a police investigation occurs or some other checks are undertaken (such as cross-checking customer data with known fraudsters). Similar challenges apply in many other areas where we don’t get immediate feedback (e.g. disease risk prediction, credit risk prediction, future property values, long-term stock market prediction). Given these constraints, it is logical to monitor proxy values to model accuracy in production, specifically:
- model prediction distribution (regression algorithms) or frequencies (classification algorithms),
- model input distribution (numerical features) or frequencies (categorical features), as well as missing value checks
Model Input Monitoring
Given a set of expected values for an input feature, we can check that a) the input values fall within an allowed set (for categorical inputs) or range (for numerical inputs) and b) that the frequencies of each respective value within the set align with what we have seen in the past.
For example, for a model input of “marital status” we would check that the inputs fell within the expected values shown in this image:
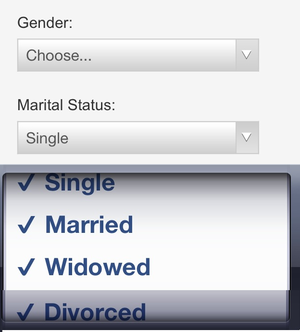
Depending on our model configuration, we will allow certain input features to be null or not. This is something we can monitor. If features we expect generally to not be null start to change, that could indicate a data skew or change in consumer behavior, both of which would be cause for further investigation.
Model Prediction Monitoring
In either an automated (more on this in coming sections) or manual process we can compare our model prediction distributions with statistical tests:
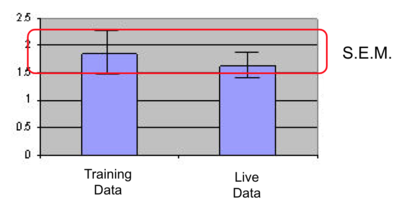
Basic statistics: median, mean, standard deviation, max/min values
For example, if the variables are normally distributed, we would expect the mean values to be within the standard error of the mean interval. This of course is a very simplistic statistical approach.
Advanced techniques
We can also implement full-blown statistical tests to compare the distribution of the variables. Which test? This depends on the variable characteristics. If the variables are normally distributed we could do a t-test or ANOVA, if they are not, perhaps non-parametric tests like Kruskall Wallis or the Kolmogorov Smirnov are more suitable. Here we want to compare variable by variable if the distribution of the variable in the training data is similar to what we see in production for that variable.
Practically speaking, implementing advanced statistical tests in a monitoring system can be difficult, though it is theoretically possible. More typical is to automate basic statistical tests (particularly standard deviation of inputs/outputs) over time, and do ad-hoc manual testing to apply more advanced checks. We will now delve into the automation options.
7. Operations Monitoring Concerns
Monitoring in the realm of software engineering is a far more well-established area and is part of Site Reliability Engineering. A great (free) reference book for this is Google’s SRE Handbook. The operational concerns around our ML System consist of the following areas:
- System Performance (Latency)
- System Performance (IO/Memory/Disk Utilisation)
- System Reliability (Uptime)
- Auditability (though this applies also to our model)
In software engineering, when we talk about monitoring we’re talking about events. Events can be almost anything, including:
- Receiving an HTTP request
- Sending an HTTP 400 response
- Entering a function (which may contain ML code or not)
- Reaching the else of an if statement
- Leaving a function
- A user logging in
- Writing data to disk
- Reading data from the network
- Requesting more memory from the kernel
All events also have context. For example, an HTTP request will have the IP address it is coming from and going to, the URL being requested, the cookies that are set, and the user who made the request. Events involving functions have the call stack of the functions above them, and whatever triggered this part of the stack such as an HTTP request. Having all the context for all the events would be great for debugging and understanding how your systems are performing in both technical and business terms, but that amount of data is not practical to process and store.
Therefore monitoring is broken down into different areas, each of which is to do with reducing that volume of data to something workable.
The so-called three pillars of observability describe the key ways we can take event context and reduce the context data into something useful. They are:
- Metrics
- Logs
- Distributed Traces
With some occasional extra members depending on who you ask such as (4) Profiling (5) Alerting/visualization (although this is usually baked into metrics/logs)
Monitoring vs. Observability
So what’s the difference between monitoring and observability? Simply put, observability is your ability to answer any questions about what’s happening on the inside of your system just by observing the outside of the system. For a great history of observability, I would recommend Cindy Sridharan’s writing, for example this article, as well as her book Distributed Systems Observability
At this point, a Venn diagram is useful:
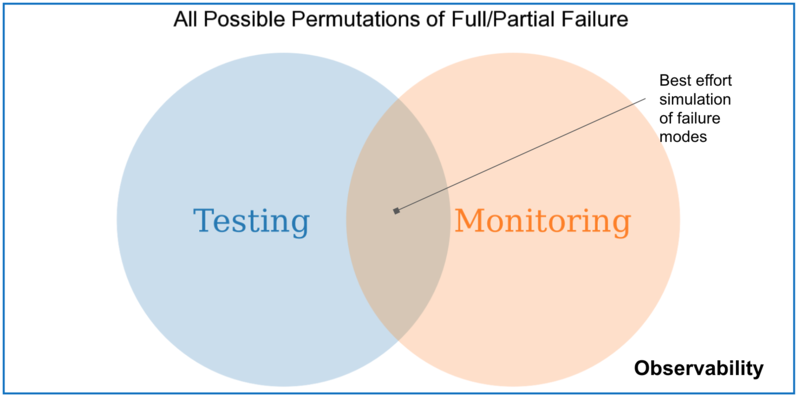
This diagram captures:
- Testing - Our best effort verification of correctness
- Monitoring - Our best effort to track predictable failures
Observability is a superset of both monitoring and testing: it provides information about unpredictable failure modes that couldn’t be monitored for or tested.
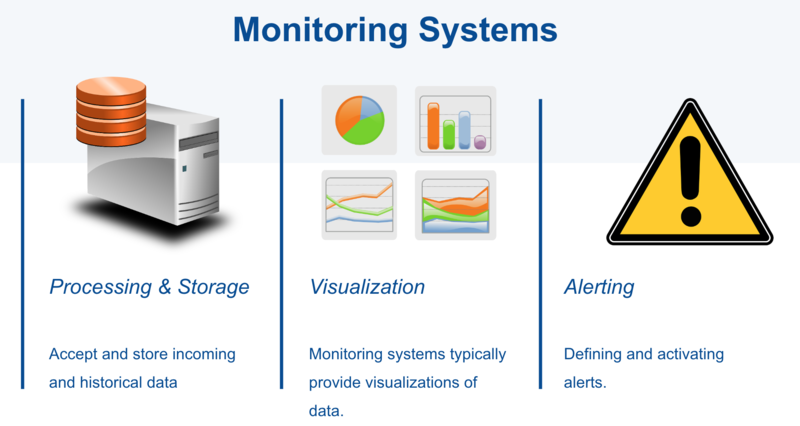
Monitoring and alerting are interrelated concepts that together form the basis of a monitoring system. A monitoring system is responsible for storage, aggregation, visualization, and initiating automated responses when the values meet specific requirements.
When it comes to monitoring ML systems, distributed tracing specifics tend to be very similar to the setup for a non-ML system. As a result, I won’t discuss them here. For logs & metrics, however, there are some noteworthy ML system considerations, which I will now dive into.
8. Bringing Ops & DS Together - Metrics with Prometheus & Grafana
Metrics represent the raw measurements of resource usage or behavior that can be observed and collected throughout your systems. These might be low-level usage summaries provided by the operating system, or they can be higher-level types of data tied to the specific functionality or work of a component, like requests served per second or outputs from a particular function.
Pros of Metrics (paraphrasing liberally from Distributed Systems Observability):
- Unlike log generation and storage, metrics transfer and storage has a constant overhead.
- Since numbers are optimized for storage, metrics enable longer retention of data as well as easier querying. This makes metrics well-suited to creating dashboards that reflect historical trends, which can be sliced weekly/monthly etc.
- Metrics are ideal for statistical transformations such as sampling, aggregation, summarization, and correlation. Metrics are also better suited to trigger alerts, since running queries against an in-memory, time-series database is far more efficient.
Cons of Metrics:
- Metrics allow you to collect information about events from all over your process, but with generally no more than one or two fields of context.
- Cardinality issues (the number of elements of the set): Using high cardinality values like IDs as metric labels can overwhelm timeseries databases.
- Scoped to one system (i.e. only one service in a collection of microservices)
Metrics for Machine Learning
Given the above pros and cons, metrics are a great fit for both operational concerns for our ML system:
- Latency when calling ML API endpoints
- Memory/CPU usage when performing prediction
- Disk utilization (if applicable)
As well as for prediction monitoring centered around basic statistical measures:
- Median & mean prediction values over a given timeframe
- Min/Max prediction values
- Standard deviation over a given timeframe
Practical Implementation
One of the most popular open-source stacks for monitoring metrics is the combination of Prometheus and Grafana.
To avoid this post turning into a book, I won’t go into a detailed explanation of these technologies. The best place to learn more is Brian Brazil’s book and training courses. A quick summary from the documentation:
Prometheus scrapes metrics from instrumented jobs, either directly or via an intermediary push gateway for short-lived jobs. It stores all scraped samples locally and runs rules over this data to either aggregate and record new time series from existing data or generate alerts. Grafana or other API consumers can be used to visualize the collected data.
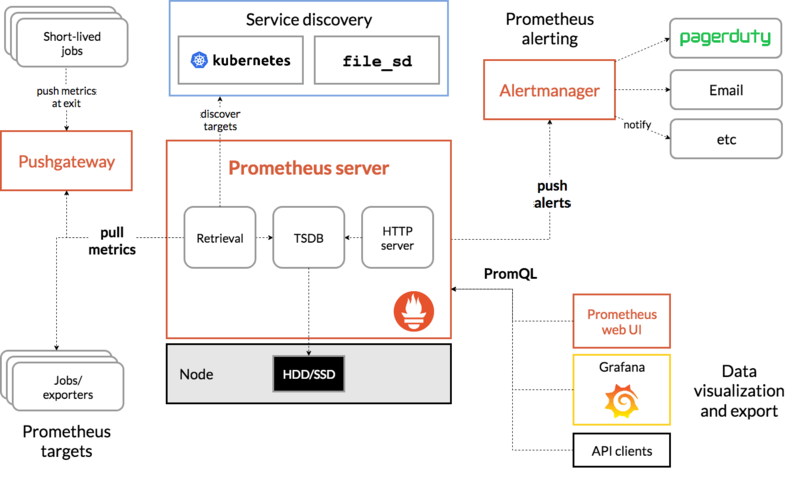
source: Prometheus documentation
We can create dashboards with Prometheus & Grafana to track our model standard statistical metrics, which might look something like this:
You can use these dashboards to create alerts that notify you via slack/email/SMS when model predictions go outside of expected ranges over a particular timeframe (i.e. anomaly detection), adapting the approach described here for ML. This then would then prompt a full-blown investigation around usual suspects such as:
- Is there a bug in the pipeline?
- Have we deployed the wrong model? (surprisingly common)
- Is there an issue with the dataset?
- Has the model gone stale?
9. Bringing Ops & DS Together - Logs
An event log (usually just called “logs”) is an immutable, time-stamped record of discrete events that happened over time.
Pros of logs:
- Logs are very easy to generate, since it is just a string, a blob of JSON or typed key-value pairs.
- Event logs excel when it comes to providing valuable insight along with enough context, providing detail that averages and percentiles don’t surface.
- While metrics show the trends of a service or an application, logs focus on specific events. The purpose of logs is to preserve as much information as possible on a specific occurrence. The information in logs can be used to investigate incidents and to help with root-cause analysis.
Cons of logs:
- Logging excessively has the capability negatively affect system performance
- As a result of these performance concerns, aggregation operations on logs can be expensive and for this reason alerts based on logs should be treated with caution.
- On the processing side, raw logs are almost always normalized, filtered, and processed by a tool like Logstash, fluentd, Scribe, or Heka before they’re persisted in a data store like Elasticsearch or BigQuery. Setting up & maintaining this tooling carries with it a significant operational cost.
Logging for Machine Learning
If we consider our key areas to monitor for ML, we saw earlier how we could use metrics to monitor our prediction outputs, i.e. the model itself. However, investigating the data input values via metrics is likely to lead to high cardinality challenges, as many models have multiple inputs, including categorical values. Whilst we could instrument metrics on perhaps a few key inputs, if we want to track them without high cardinality issues, we are better off using logs to keep track of the inputs. If we were working with an NLP application with text input then we might have to lean more heavily on log monitoring as the cardinality of language is extremely high.
We would check for input red flags such as:
- A feature becoming unavailable - (either vanishing from inputs, or a high number of NAs)
- Notable shifts in the distribution of key input values, for example, a categorical value that was relatively rare in the training data becomes more common
- Patterns specific to your model, for example in an NLP scenario a sudden rise in the number of words not seen in the training data
Practical Implementation
Kibana is an open-source analytics and visualization platform which is part of the elastic stack, formerly the ELK stack. You use Kibana to search, view, and interact with logs stored in Elasticsearch indices. You can easily perform advanced data analysis and visualize your logs in a variety of charts, tables, and maps. This is one of the most common open-source stacks for building monitoring systems for logs
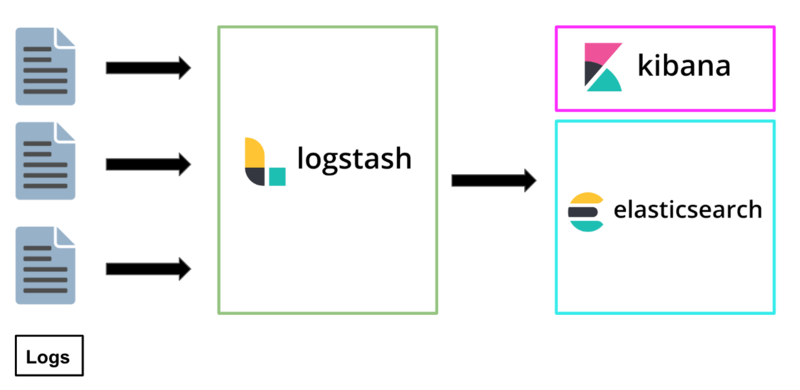
Within Kibana you can setup dashboards to track and display your ML model input values, as well as automated alerts when values exhibit unexpected behaviors. Such a dashboard might look a bit like this:
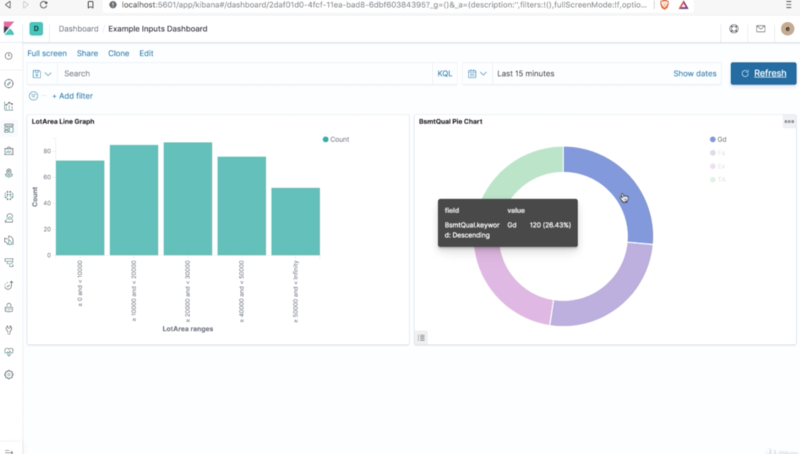
This is one possible choice for a logging system, there are also managed options such as logz.io and Splunk.
10. The Changing Landscape
Hopefully this article gives you a much clearer idea about what monitoring for machine learning really means, and why it matters. As I hope is apparent, this is an area that requires cross-disciplinary effort and planning in order to be effective. It will be interesting to see how the tools evolve to meet the increasing frustration of many business who experience the high of an ML deployment only to then be poorly equipped to monitor that deployment and get burned because of changes in the environment a few months later. Interesting developments to watch include:
-
The big AI players’ efforts to improve their machine learning model solution monitoring, for example Microsoft has introduced “Data Drift” in Azure ML Studio, or the greedy book store’s improvements in SageMaker. Naturally these come with the usual vendor-lock in and flexibility constraints of not building in-house.
-
Scrappy start-up attempts to build innovative tooling to ease model monitoring, for example Seldon, Data Robot, MLFlow and others.
-
Open-source initiatives in the MLOps space. I think KF Serving might provide some much-needed standardization which could simplify the challenges of building monitoring solutions. Watch this space.
By this time next year the landscape will probably look very different.
But we knew that, because…